Change detection helps you monitor sudden changes in metric behavior, especially on the metrics with an indefinite threshold. You can assign change detection parameters to monitors/metrics to receive alerts when significant change is detected.
Change detection applies online machine learning with a sliding window, which means the change is calculated as soon as the new data point becomes available.
Key highlights
- OpsRamp considers a sliding window of four hours to calculate the deusingtion of a value from its mean and determine if an alert should be triggered.
- If a continuous significant change is detected, then an alert is appended to the existing alert.
- If no change is detected after four hours, the alert is automatically healed.
- OpsRamp requires a minimum of four hours of real-time data to process change detection.
- Change Detection does NOT work with monitors configured only for 10 – 15 minutes duration.
- Change Detection monitoring is limited to 25 resources.
Creating change detection
Change detection can be created only from a monitoring template. To configure change detection:
- Click All Clients, select a client.
- Go to Setup > Monitoring > Templates.
- Click + to create a template.
- Provide the template details.
The monitors/metrics appear based on the selected Collector Type. For example, if you select Collector Type as Agent, then Performance Monitors, Application Monitors are displayed and if you select Collector Type as AWS, then AWS Metrics are displayed. - Click Add against the required monitors/metrics.
The required monitor/metric window is displayed. - From When to Alert drop-down menu, click Significant Change is Seen and configure the metric details.
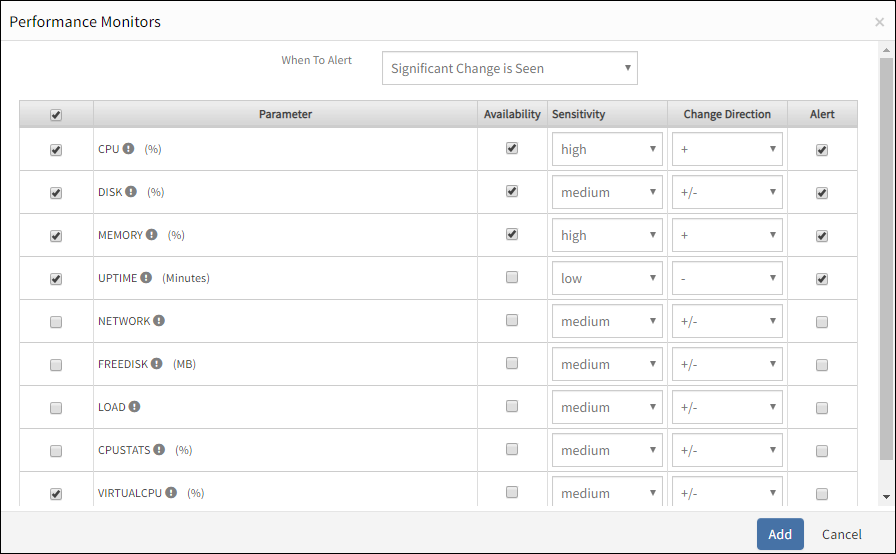
Configure Change Detection
- Click Add.
You are navigated to the MONITOR TEMPLATE page where the configured parameters for change detection appear in the respective Monitors/Metrics section.
Repeat the same steps to add change detection parameters for other Monitors/Metrics available according to the selected collector type. - From the MONITOR TEMPLATE page, click Save.
After configuring a monitoring template, assign the template to a resource. OpsRamp monitors the resource and triggers alerts when significant changes are detected on the metrics based on the configured values.Note
To unassign only for one change detection monitor/metric, select the monitor/metric from the Significant Change is Seen list and click Remove. To unassign for all monitors/metrics, select the checkbox against the Name field in the table and then click Remove.
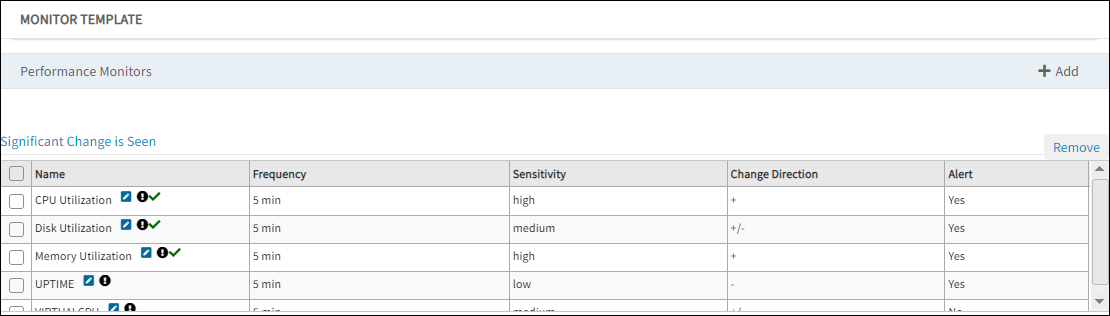
Selected metrics for change detection
Viewing change detection performance
You can view the Change Detection results in the form of graphs. You can either view the graph from the Infrastructure page or from the Dashboard page after creating a widget.
Viewing the change detection graph from Infrastructure
To view a change detection graph:
- Go to Infrastructure.
- Click the resource name.
The resource Overview page is displayed. - Click Metrics.
The metric graphs are displayed. For example, see the graph below.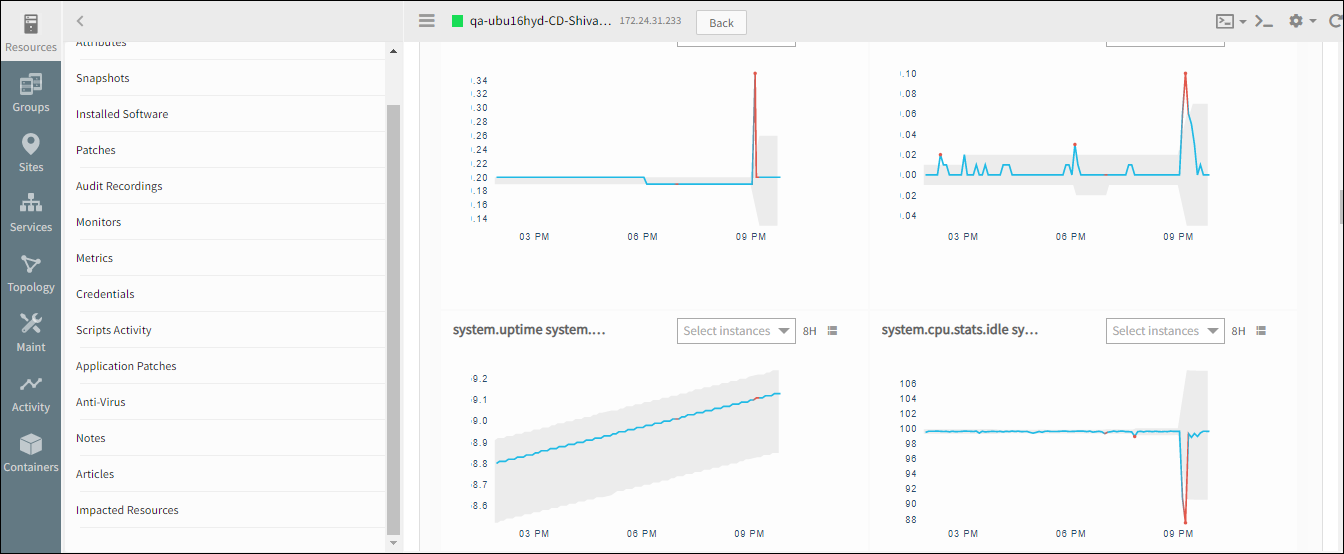
Change detection graphs of a resource
Viewing the change detection graph from Dashboard
To view a change detection graph:
- Go to Dashboard > + Add Widget.
- Click Generic.
- From Create Widget window, select the resource and resource type.
- From Time Series Type drop-down list, select Change Detection.
- Select the device component and then select the duration of the last occurred change detection.
- Provide Widget Title, select either of the chart types Line Chart or Area Chart, and then click Save.
The change detection widget appears on the Dashboard.
Change detection fields
The following table provides information on change detection configuration fields.
| Field | Description |
|---|---|
| Availability | Enable a metric as an availability metric. Availability indicates that when no critical alerts are triggered on the metric, then resource status is considered as Up. |
| Sensitivity |
|
| Change Direction | Change in direction of metric behavior. You can choose to receive alerts when there is a sudden increase or decrease in metric values.
|
| Alert | Determines if a monitor triggers an alert when Warning or Critical threshold is breached. |